Friday 12 February 2016

Peak Civilization?

Peak  Oil, Peak Everything 
By Peter Goodchild


http://www.survivepeakoil.blogspot.ca/2016/02/peak-oil-peak-everything.html

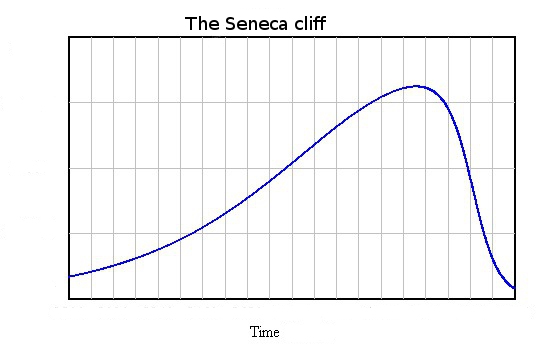
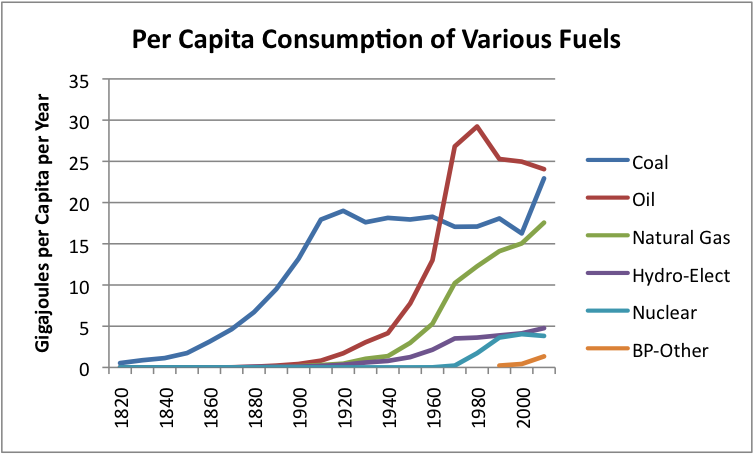
Perhaps the most common response to the peak-oil problem is: "The oil isn't going to disappear overnight. We have a century to prepare." Unfortunately, the fact that the decline in oil is a curve, not a vertical line, makes it difficult to comprehend. What matters is that the serious damage will have been done long before we get to those tiny remaining drops. That damage started around 1970, and it was not confined to oil.


Also, there are "curves within curves," so to speak. "Peak oil" in an ABSOLUTE sense was around 2010, but "peak oil" PER CAPITA was 1979, when there were 5.5 barrels of oil per person annually. According to UN estimates (admittedly quite uncertain), the world's population will rise to about 8 billion or more in 2030, whereas a look at the usual (or, at least, realistic) estimates for oil production show a decline to about 15 billion barrels in 2030, giving us a "per capita" figure of less than 2 barrels. That figure will not constitute an "on/off" situation, but by that year 2030 the human race should probably say goodbye to the Oil Economy.


It is not only oil, but in fact the entire North American economy that has followed something like a bell curve. In many ways it was not 2010, or any other year in the early 21st century, but the year 1970, that was the Peak, the Big Peak of Everything. Backward or forward on that curve, we see a dirty, noisy, crowded world. Right on that Peak, we see the Golden Age -- Beatlemania, "sex, drugs, and rock 'n' roll," Easy Street. As Dickens might say, "It was the best of times, it was the worst of times." The gap between the rich and the poor was not so bad in those days, whereas according to the US Census Bureau the mean income of the richest 5 percent of American families began to skyrocket shortly before 1970. In the year 1968, there was the Tet offensive, the turning point of the Vietnam War -- from an American military point of view, the downturn. In the year 1969, there was the first moon landing -- "the Space Age" began, although within a few years the expression (like "the Atomic Age") would be just an embarrassment.

The above-mentioned statement, "We have a century to prepare," also raises the question: Who is the "we" here? All human beings? A small group of dedicated survivalists? If the answer is the former, then the statement is false: humanity, as a whole, never makes any decisions. The human race, taken in its entirety, simply does not behave in such a sophisticated manner; the human race much prefers ignorance, superstition, cruelty, and intolerance. Robert Kaplan's book The Ends of the Earth is one of many texts that elucidate the harsh reality of human nature.

What about the coming several decades? Of course, a great deal depends on which time period one is discussing: the world of 2100 will be very different from the world of 2030. The question of slow versus fast collapse will also have a big effect on future scenarios. But if we look at tangible events of the last hundred years, two possible conceptions of the future stand out most clearly. These have best been illustrated by novelists (although not with peak oil as the setting) rather than by sociologists.

Image result for oil production 2100

The first is that of a slow slide into an impoverished police state, as illustrated by George Orwell’s 1984. In this scenario, government does not disappear. It is here to curse us forever. We may be poor and living in chaos, but we will live in relentless drudgery. This is roughly the same scenario as that of the Great Depression of the 1930s.

The second is that of a nuclear war that throws humanity back into a quasi-medieval world, as in Walter M. Miller, Jr., A Canticle for Leibowitz. In the fight for the remaining resources, civilization is largely destroyed. Such a scenario is just as plausible as that of George Orwell.


All civilizations grow too large to support themselves, and their leaders have little foresight. These civilizations then collapse and are buried in the sand. The same will happen to American civilization, but human shortsightedness prevents us from seeing it as only one among many. The USA, in other words, is seen as "civilization" in a generic sense, when it is really just one single civilization in a quantifiable sense. Unlike that of ancient Egypt, however, it is not likely to have a lifespan of three thousand years. Nor is it likely that another will take its place.


Watch  More


Wednesday 10 February 2016

Physics Sets the Stage For Economic Collapse

The Physics of Energy and the Economy

I approach the subject of the physics of energy and the economy with some trepidation. An economy seems to be a dissipative system, but what does this really mean? There are not many people who understand dissipative systems, and very few who understand how an economy operates. The combination leads to an awfully lot of false beliefs about the energy needs of an economy.
The primary issue at hand is that, as a dissipative system, every economy has its own energy needs, just as every forest has its own energy needs (in terms of sunlight) and every plant and animal has its own energy needs, in one form or another. A hurricane is another dissipative system. It needs the energy it gets from warm ocean water. If it moves across land, it will soon weaken and die.
There is a fairly narrow range of acceptable energy levels–an animal without enough food weakens and is more likely to be eaten by a predator or to succumb to a disease. A plant without enough sunlight is likely to weaken and die.
In fact, the effects of not having enough energy flows may spread more widely than the individual plant or animal that weakens and dies. If the reason a plant dies is because the plant is part of a forest that over time has grown so dense that the plants in the understory cannot get enough light, then there may be a bigger problem. The dying plant material may accumulate to the point of encouraging forest fires. Such a forest fire may burn a fairly wide area of the forest. Thus, the indirect result may be to put to an end a portion of the forest ecosystem itself.
How should we expect an economy to behave over time? The pattern of energy dissipated over the life cycle of a dissipative system will vary, depending on the particular system. In the examples I gave, the pattern seems to somewhat follow what Ugo Bardi calls a Seneca Cliff.
Figure 1. Seneca Cliff by Ugo Bardi
Figure 1. Seneca Cliff by Ugo Bardi
The Seneca Cliff pattern is so-named because long ago, Lucius Seneca wrote:
It would be some consolation for the feebleness of our selves and our works if all things should perish as slowly as they come into being; but as it is, increases are of sluggish growth, but the way to ruin is rapid.

The Standard Wrong Belief about the Physics of Energy and the Economy
There is a standard wrong belief about the physics of energy and the economy; it is the belief we can somehow train the economy to get along without much energy.

In this wrong view, the only physics that is truly relevant is the thermodynamics of oil fields and other types of energy deposits. All of these fields deplete if exploited over time. Furthermore, we know that there are a finite number of these fields. Thus, based on the Second Law of Thermodynamics, the amount of free energy we will have available in the future will tend to be less than today. This tendency will especially be true after the date when “peak oil” production is reached.
According to this wrong view of energy and the economy, all we need to do is design an economy that uses less energy. We can supposedly do this by increasing efficiency, and by changing the nature of the economy to use a greater proportion of services. If we also add renewables (even if they are expensive) the economy should be able to get along fine with very much less energy.
These wrong views are amazingly widespread. They seem to underlie the widespread hope that the world can reduce its fossil fuel use by 80% between now and 2050 without badly disturbing the economy. The book 2052: A Forecast for the Next 40 Years by Jorgen Randers seems to reflect these views. Even the “Stabilized World Model” presented in the 1972 book The Limits to Growth by Meadow et al. seems to be based on naive assumptions about how much reduction in energy consumption is possible without causing the economy to collapse.


The Economy as a Dissipative System
If an economy is a dissipative system, it needs sufficient energy flows. Otherwise, it will collapse in a way that is analogous to animals succumbing to a disease or forests succumbing to forest fires.


The primary source of energy flows to the economy seems to come through the leveraging of human labor with supplemental energy products of various types, such as animal labor, fossil fuels, and electricity. For example, a man with a machine (which is made using energy products and operates using energy products) can make more widgets than a man without a machine. A woman operating a computer in a lighted room can make more calculations than a woman who inscribes numbers with a stick on a clay tablet and adds them up in her head, working outside as weather permits.
As long as the quantity of supplemental energy supplies keeps rising rapidly enough, human labor can become increasingly productive. This increased productivity can feed through to higher wages. Because of these growing wages, tax payments can be higher. Consumers can also have ever more funds available to buy goods and services from businesses. Thus, an economy can continue to grow.
Besides inadequate supplemental energy, the other downside risk to continued economic growth is the possibility that diminishing returns will start making the economy less efficient. These are some examples of how this can happen:
  • Deeper wells or desalination are needed for water because aquifers deplete and population grows.
  • More productivity is needed from each acre of arable land because of growing population (and thus, falling arable land per person).
  • Larger mines are required as ores of high mineral concentration are exhausted and we are forced to exploit less productive mines.
  • More pollution control devices or higher-cost workarounds (such as “renewables”) are needed as pollution increases.
  • Fossil fuels from cheap-to-extract locations are exhausted, so extraction must come from more difficult-to-extract locations.
In theory, even these diminishing returns issues can be overcome, if the leveraging of human labor with supplemental energy is growing quickly enough.
Theoretically, technology might also increase economic growth. The catch with technology is that it is very closely related to energy consumption. Without energy consumption, it is not possible to have metals. Most of today’s technology depends (directly or indirectly) on the use of metals. If technology makes a particular type of product cheaper to make, there is also a good chance that more products of that type will be sold. Thus, in the end, growth in technology tends to allow more energy to be consumed.
Why Economic Collapses Occur

Read More

Or 

Related and Recommended
Paradise Lost
by 
Paul Chefurka 
 Or 

"Watch A Related Recommended Video"


Sunday 7 February 2016

Energy 2050 Apocalypse - The Road to Exhaustion (Part 6)

Energy 2050 Apocalypse


World Energy to 2050
  Forty Years of Decline
Putting Energy Sources in Perspective
Part 6
By Paul Cherfurka
http://www.paulchefurka.ca/


Putting Energy Sources in Perspective


Figure 11: Energy Use by Source, 1965 to 2100


Figure 11 shows all the above curves on a single graph, giving us a sense of the relative timing of the various production peaks as well as the rates of increase or decline of the different sources. As you can see, fossil fuels are by far the most important contributors to the world's current energy mix, but oil and natural gas will decline rapidly over the coming decades. By the middle of the century the dominant player is coal, with oil, gas, hydro, nuclear power and renewables making very similar contributions to the world's mid-century energy supply.


Figure 12: The Global Energy Mix in 1965, 2005 and 2050


Figure 12 shows the changing contribution of each energy source relative to the others over time.  There are three interesting things to note about this progression.

The first is the large role that coal plays in the global supply picture.  That situation is not entirely unexpected, but it hints at the difficulty we will have trying to replace our dirtiest and most dangerous energy source as our supplies of oil and gas decline.

The second is the increasing diversity of energy sources over time.  This change is a good thing, as it indicates that various regions will have a much wider range of energy options available to them than in the past.

Finally, by mid-century energy sources that do not generate greenhouse gases may be supplying 40% of the world's power as opposed to 13% today and only 5% in 1965.  Combined with an overall (albeit involuntary) reduction in global energy use by 2050, that shift bodes well for reducing the carbon dioxide our civilization exhales into the atmosphere.


Figure 13: Total Energy Use, 1965 to 2100


Figure 13 has all the energy curves added together to show the overall shape of total world energy consumption. This graph aggregates all the rises, peaks and declines to give a sense of the complete energy picture.  The graph shows a strong peak in about 2020, with an ongoing decline out to 2050. The main reason for the decline is the loss of oil and gas. The decline is cushioned by an increase in hydro and renewables over the middle of the century, and averages out to 1% per year.


Fuel vs. Electricity


The energy we use can be broadly categorized into two classes, fuel and electricity.  The former consists of oil and gas, the two sources that will be in decline over the next half century.  The amount of electricity we produce from all other sources including coal will increase, though not enough to offset the decline in fuels in terms of the energy they supply.  Figure 14 shows show how the split between the two classes of energy will change over the next 45 years.


Figure 14: Fuel and Electricity Use, Today and 2050

In addition to the loss of transportation mobility it represents, the loss of the enormous contributions of oil and natural gas means that the total amount of energy available to humanity by the middle of the century may be only 70% of the amount we use now. That shortfall contains an ominous message for our future that is the subject of the next section.

Image result for horse and buggy 1800s

Next
Part 7: Effects and Conclusion
(February 27, 2016)